Wisdom of Crowds
Table of Contents
Intro
Every now and then, we read some bulge brackets hit the headline, “XXX will reach 99999€ in 20YY”. Some forecasts hit the bull’s eye but most projections are as accurate as astrology. Price prediction can be easily influenced by the cognitive bias. In the financial market, there is merit to the idea that consensus estimate is the best oracle. By harnessing the power of ensemble learning, we are about to leverage Dawid-Skene model and Platt-Burges model to eliminate the idiosyncratic noise associate with each individual judgement. The end game is to reveal the underlying intrinsic value generated by the collective knowledge of research analysts from different investment banks. Is wisdom of crowds a crystal ball for trading?
To evaluate the accuracy of the consensus estimate, 11 commodity prices forecasted by 8 different investment banks are collected as a sample. For any outsider, investment banks do not revise their forecast frequently, especially their long-term forecast. Because investment banks generate their revenue via customers’ block trading instead of report subscriptions. There is no incentive for any research analyst to frequently change the tune of the underlying asset. Apart from no extra bonus, it also makes them seem indecisive and poor at making prediction (which is true, you will see…). Has anyone watched the TV show “Industry”? One big night with the client is worth a thousand reports! Report writers are at the bottom of the food chain.
With that being said, we are only examining current year and one-year ahead outlooks. Unfortunately, these banks do not publish reports at the same date. We cannot pick a random date and expect numbers from all the banks. Oddly enough, most of the investment banks publish new research piece in August. With two-thirds of a year is passed, analysts are busy revising everything. This is where our dataset comes from. We take current year and one-year ahead outlook written in August 2019 to form a bank vs commodity matrix where each element is the normalized forecast price (percentage return). To ensure we end up with a complete matrix (to do matrix completion is another level of the problem), bank candidates are shortlisted to BMO, BOAML, Citi, Commonwealth, Deutsche, Goldman Sachs, JP Morgan and TD securities. Commodities are filtered into Brent, copper, Henry Hub, nickel, silver, WTI, thermal coal and zinc. Some of you may say the dataset is too small to be representative. This is not cherry picking. I have a consensus dataset fully traced back to 2010 but it takes an excessive amount of work to ETL complete matrices for each year. You are always welcome to challenge my result with your own dataset or simply MarketWatch rating history. The conclusion is highly likely to stay the same…
To effectively measure the wisdom of crowds, we need a control group – spot price. Initially, we would’ve thought spot price is a terrible idea. The market is turbulent and the spot price prediction is always flat. We can always expect some amount of forecast error coming out of it. In our best-case scenario, consensus estimate may be able to predict the exact price in the future. Well, mark-to-market is a standard practice in risk management. All open positions are marked to the spot market instead of the futures market. Spot price should contain more information than futures price in an efficient market. Thus, spot price will be on par with consensus estimate in our little experiment.
Descriptive Statistics
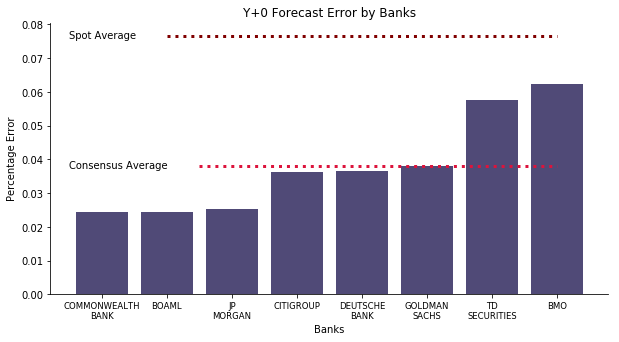
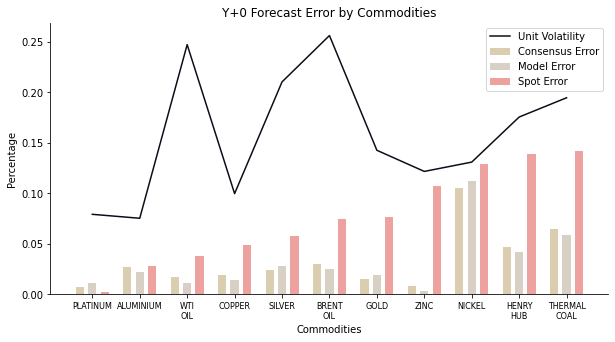
We start the experiment with the basics, descriptive statistics. What is the mean absolute error of each forecast? Does one particular bank outperform the rest? The chart below reveals the insight we are seeking for. For the current year outlook, consensus forecast error regardless of the commodity is 4% on average. Spot forecast error regardless of the commodity yields almost 8%, twice as large as consensus. Yet, I cannot say this is the wisdom of crowds. Since you can compute year-to-date average price with 66% of the data, how likely the rest 33% of the data is going to drift the annual average away? Additionally, the error is unequally distributed within the banks. The worst performer, BMO, has triple as much error as the best performer, Commonwealth.
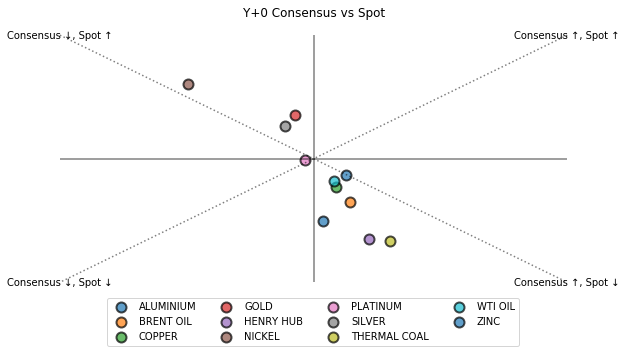
Next, we create a scatter plot to put consensus under further scrutiny. The chart is shown below where X axis represents consensus and Y axis represents spot. Coincidentally, consensus and spot never demonstrate the same systemic bias. It is always one overestimates ↑ and the other underestimates ↓. Aside from platinum which both consensus and spot are doing well (a sign of low volatility), spot always have a larger magnitude of systemic bias than consensus in other commodities because the diagonal line is at 45 degree where spot and consensus have the same scale of the bias. This phenomenon indicates 2019 was quite a volatile time for commodities.
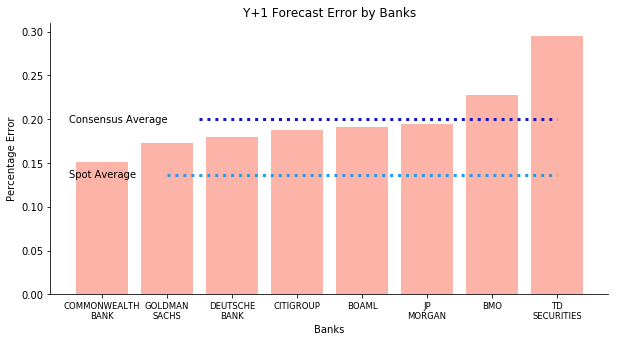
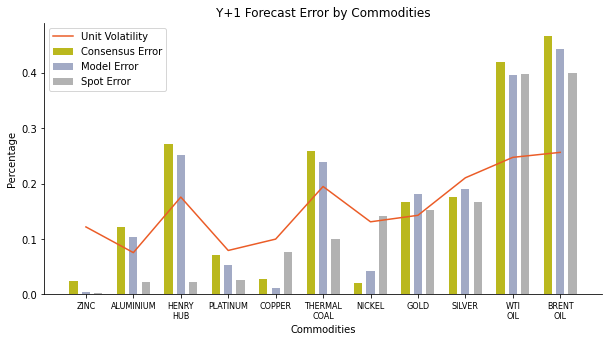
That’s enough about the current year outlook. As mentioned before, knowing 66% of the data is quite an unfair advantage for consensus. One year ahead forecast is how spot price levels the playing field. The chart below shows how the performance of consensus forecast rapidly deteriorates. Spot forecast error regardless of the commodity is at least 5% less than consensus forecast error despite the fact it is twice as large as current year outlook. None of the banks can outperform spot price. Where is the wisdom of crowds? Furthermore, TD Securities and BMO are consistently the worst performers with errors at 25% and 30% respectively. Commonwealth maintains its reputation as the best prophet, still at 15% forecast error. I cannot stop wondering why Canadian bank is so bad given both Australia and Canada are big commodity exporters.
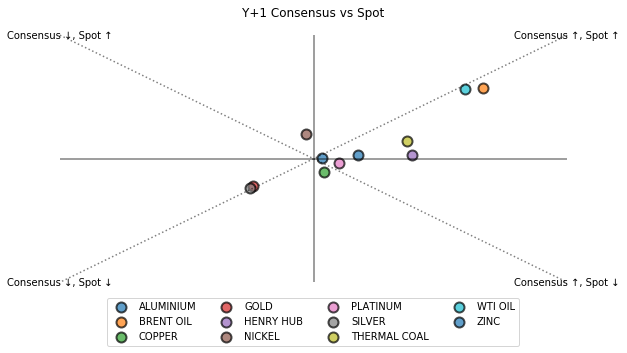
The scatter plot is even more intriguing. Excluding precious metal silver and gold, the rest of the commodities are mostly in the spectrum of consensus ↑ and spot ↑. Well, we all know 2020 is a special year especially one particular mismanagement fucked up the whole world. The safe haven commodity behavior doesn’t arouse our interest. It is the data point under the diagonal line that suggests consensus forecast has a bigger scale of systemic bias in one year ahead outlook. spot ↑ is an indication of bearish market in 2020. We can easily derive that consensus forecast of 2020 > spot price in 2019 > actual price in 2020. With that being said, we have discovered a consensus forecast overshoot. Where does consensus optimism come from? Simple, momentum. If you look up the historical price, August 2019 happened to be the recovery period where price gradually picked up. In another word, hundreds of thousands of dollars spent on research reports are merely for a momentum check? No wonder people prefer to spend those dollars on big nights with clients 😳 The idea of momentum may work on short term such as current year outlook. In one year ahead outlook, the wisdom of crowds just vanishes into thin air (or if it ever exists).
Dawid-Skene Model
Now that we have seen the malaise of descriptive statistics. The consensus average is supposed to eliminate random errors that affect each banker’s answer in a different way, yet the average error is still ridiculously large. Perhaps the method of averaging is too naïve. A more advanced model is summoned to tackle the base rate bias, the tendency for bankers to base predictions on what they know.
Dawid-Skene model was developed to assess a patient’s true response in regarding to different answers to different clinicians. Nowadays it is a common practice in crowd sourcing problem, e.g. data labelling for supervised learning. This model applies an algorithm on discrete classifications to aggregate individual opinions into one collective decision so that we can save money and time from domain knowledge training for data labelling. It takes into account of the heterogeneity of annotators and the complexity of fortune telling.
DS Model is one of the few model where text explanation is more comprehensive than math notations. The model per se is solved via Expectation Maximization algorithm. The steps are illustrated below.
- Initialize the prior labels with majority voting technique.
- E-step: compute the confusion matrix for each annotator and obtain the probability of each annotator’s current answer given the prior labels as conditional probability.
- M-step: obtain the fraction of the prior labels as unconditional probability and multiply it by conditional probability. Compute the posterior labels based on each label’s possibility.
- Repeat E-step and M-step until convergence. Convergence is defined as the posterior labels do not change over the iterations.
In our particular case, the annotators refer to the banks. Each question refers to a commodity. The model only contains two labels (I have never seen flat price forecast from banks), price upside risk and price downside risk.
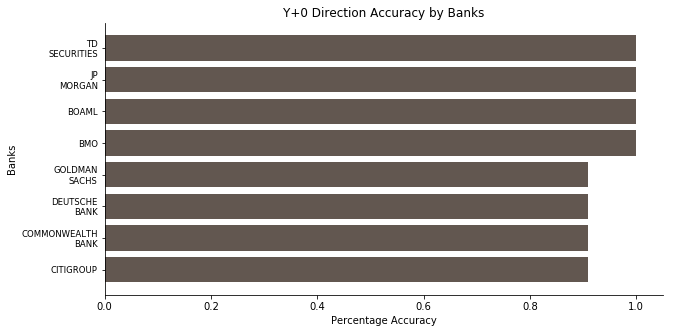
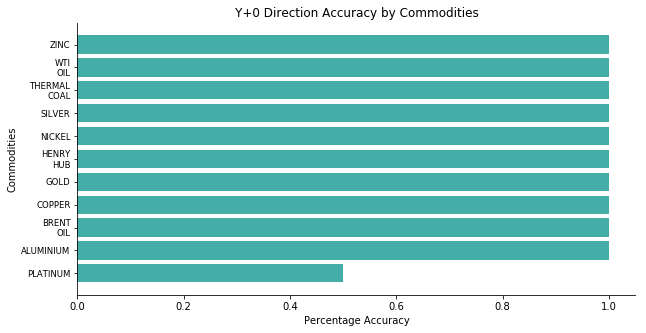
For current year outlook, the model yields the same answer as Citigroup, Commonwealth Bank, Deutsche Bank and Goldman Sachs. On the bright side, half of the banks made a 100% accurate guess whereas the other half begs to differ on only one commodity – Platinum. On the dark side, this could be an indication of monoculture. For wisdom of crowds to work, there is one crucial element, diversity (check this example in Julia to see how a group of diverse problem solvers outperform a group of elites in Waxman model). The crowds must be characterized by different opinions and each person's opinion should be independent and free from the influence of others. DS Model cannot eliminate systematic errors that affect the opinions of the entire crowd. It can merely offset random noise caused by each person’s base rate bias.
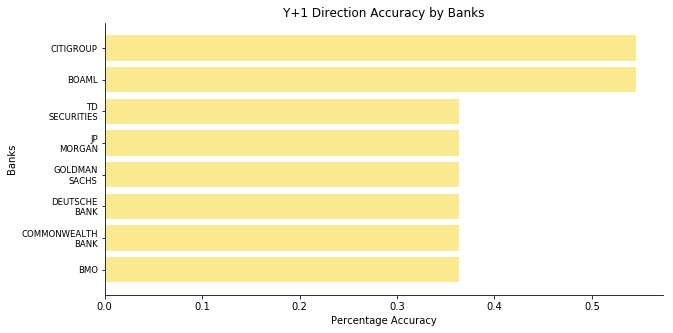
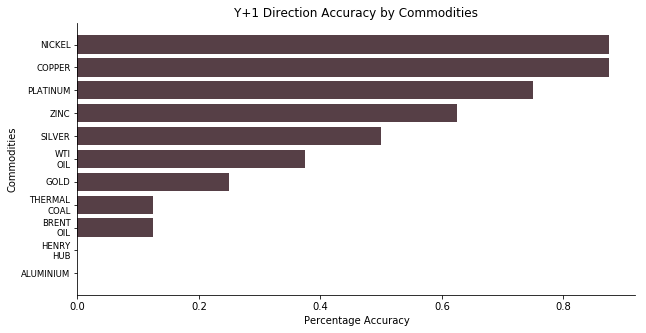
For one year ahead outlook, the model yields the same answer as JP Morgan, less than 40% of the price direction is correctly projected. Even for the best performers, Citigroup and BOAML, they do not outperform tossing a coin by any chance. In another word, these banks fail spectacularly. According to the result breakdown by commodities, nobody managed to get Aluminum and Henry Hub natural gas right. The ones with high accuracy are electric vehicle related – nickel, copper and platinum.
Au fait, DS Model is an exceptional model to calibrate the base rate bias. In its defense, the poor performance in our task is caused by the lack of diverse opinions. Financial industry does not have a diverse pool of participants. The candidates are generally screened by target university and private school at the recruitment stage. Especially when it comes to research analysts, they don’t have any collective knowledge and they forecast the market based on public polling data. To add more fuel to the fire, research analysts do not get rated by conducting excellent research or telling fascinating stories. Their rating is based upon clients’ perception. Their ability to entertain the clients is somehow more influential than their research capability (one big night with the client is worth a thousand reports). To put it plainly, there are too many analysts who cannot do Newton-Leibniz theorem right and you expect them to tell you what the price would be in one year’s time? They are good at Latin quotes used in a variety of ways in the rhetoric but beautiful anecdotical stories doesn’t mean shit in terms of proofs.
Platt-Burges Model
It is rather implausible to calibrate the direction forecast under the influence of detrimental herding effect. We can still calibrate our mentality and change the objective. Now the end game is to work on the continuous case and calibrate the price prediction to minimize the forecast error. Let’s introduce a different model called Platt-Burges.
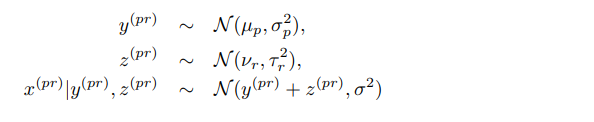
Platt-Burges model was developed to adjust the paper submission mechanism for NIPS conference. Assuming P papers are submitted to the conference and R reviewers in the committee mark the score of these papers, each paper will be given R different scores by all the reviewers (matrix completion is beyond the scope of this project). Some reviewers are harsh and they tend to give low scores to every paper. Some reviewers are moody and their scores depend on how many 🍩 they have eaten for lunch. Therefore, the score of a paper given by a reviewer, denoted as x, can be decomposed into the linear combination of three components – the underlying intrinsic value y, the reviewer bias z and some random disturbance ε. As we can only observe the variable x, y and z are the latent variables of our interest. To make the life easier, we assume x, y and z independently follow different Gaussian distributions.
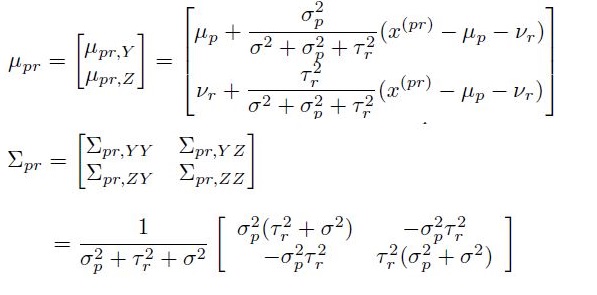
To obtain latent variables, there are two methods. One is the Expectation Maximization algorithm. Lucky for us, the solution is given in Andrew Ng’s machine learning coursework problem set 4 in autumn 2016. We can compute the posterior probability in E step
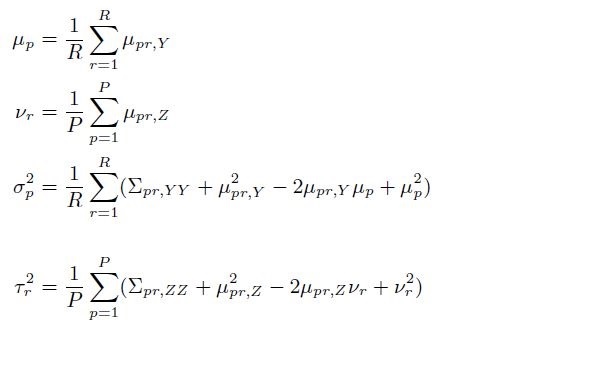
We can solve the maximum logarithm likelihood in M step
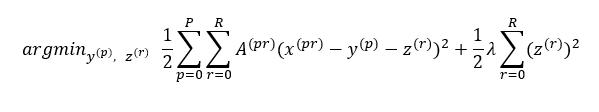
EM algorithm will be the main method in this article to approximate the reviewer bias. However, John Platt and Chris Burges proposed a regularized least squares with L2 penalty (Ridge Regression) to solve the equation in closed form. RLS will be a lot faster for PB Model to converge to local optima compared to EM algorithm. Another advantage of RLS is its adaptability to incomplete matrix via L2 norm regularization. The L2 penalty is on reviewer bias when some reviewers have not reviewed all the papers. Although the coefficient of penalty could be arbitrary as we cannot use cross validation to obtain the optima. Moreover, the adjacency matrix does not have to be binary to indicate a reviewer has reviewed a paper. The adjacency matrix can be modified into a confidence matrix where each element is within [0,1].
In our particular case, the reviewers refer to the banks. Each paper refers to the commodity price. The attempt is to aggregate the consensus forecast into one price one commodity and remove the analyst bias embedded inside the price formation.
For current year outlook, the forecast error is positively correlated with the commodity volatility apart from some outliers like Brent, WTI and silver. After all, this hardly come as any surprise. We already have seen the spot forecast error is twice as large as consensus in descriptive statistics. The only exception is platinum where spot has smaller error and this is also where half of the banks bet on the wrong direction. Meanwhile PB model has flexed some muscles. In most cases, it demonstrates a lower forecast error than raw consensus. It only fails at nickel and some precious metals such as gold, silver and platinum. The model works even in a crowd with poor judgement.
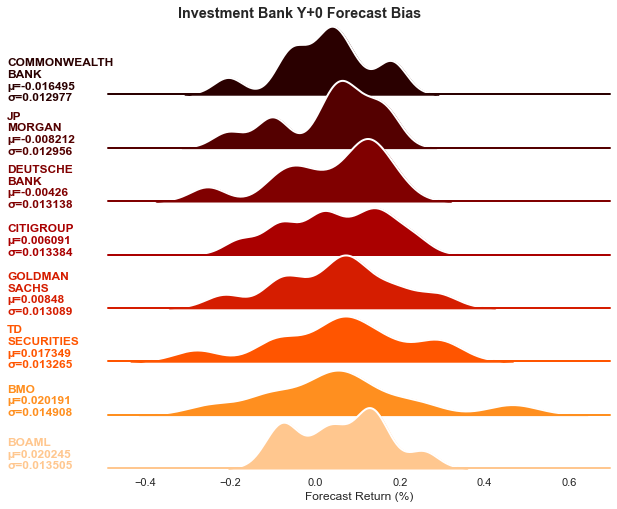
If we take a deep dive into each bank’s bias level, we can see that Commonwealth bank is the most bearish. On average, its bias is at -1.6%. Commonwealth bank also has one of the smallest standard deviation at merely 1.3%. Recalled from the descriptive statistics, Commonwealth bank is the most accurate fortune teller, consistently in both current year and one year ahead outlook. On the contrary, the second most accurate, BOAML, is the most bullish on commodities. It is also one of the moodiest fortune tellers where its mood swing (standard deviation) is the second highest. Oddly enough, the worst performers BMO and TD Securities are also bullish on commodities with volatile mood swing. It seems that bearish/bullish bias does not affect the forecast accuracy much. It is the bias volatility that determines the performance of the forecast. This makes a lot of sense. The commodity market is deeply intertwined as energy is the foundation to extract every commodity and metals are usually discovered in several groups at the exploration stage. The best forecast should be consistent with all the battle fronts.
For one year ahead outlook, we still observe the phenomenon of high volatility causing high error. As usual, we can still encounter some rebellious commodities such as Henry Hub natural gas, thermal coal and zinc. The spread between spot error and consensus error expands dramatically as the volatility decreases. On average, the spot error is merely 75% of the consensus error. Spot only fails at electric vehicle materials such as copper and nickel. Furthermore, PB model withstands the test and beats the raw consensus again. The model only fails at nickel and precious metals like gold and silver. The calibrated number usually lies between spot and consensus with a bit tilted to consensus.
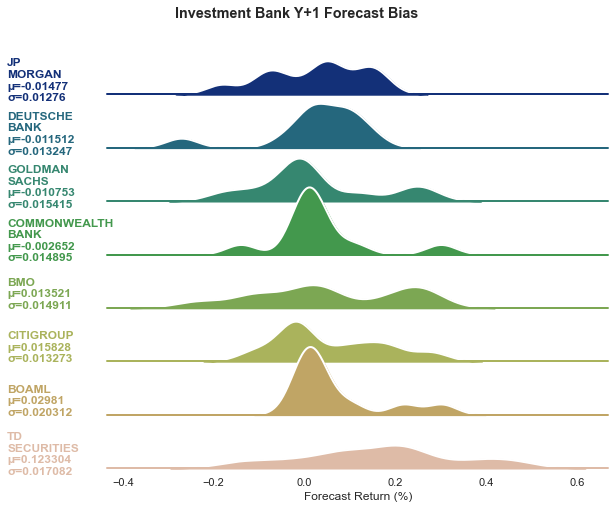
When it comes to the forecast bias, nothing is more interested than Commonwealth bank. It is consistently bearish with -0.3% and consistently outperforms the other banks. Its bias volatility is always kept at bare minimum. Other good performers such as Deutsche Bank or Goldman Sachs share the similar traits of bearish bias and small mood swing. The consistent worst performers, BMO and TD Securities are a bit different. TD Securities have the most bullish bias with ridiculously volatility whereas BMO has moderate level of forecast bias and volatility. Overall, the numbers do confirm the theory that being consistent on every aspect of the forecast is critical to minimize the error.
So, is there any intrinsic value buried under the wisdom of crowds? No. The consensus forecast is a typical example of a crowd failure. The analysts grow too conscious of the opinions of others and begin to emulate one another and to conform rather than think independently. In banks, it’s common for extraverted analysts to be featured in Bloomberg surveillance or other business interviews to gain more exposure. Once the reputation begins to snowball, the analyst’s opinion will weigh more and more among other analysts, albeit he might not necessarily be the most knowledgeable person. Other analysts would avoid challenging the star analyst’s narrative and consider him credible and trustworthy which, again, can only compound the original problem. This type of consensus thinking can, unsurprisingly, lead to poor group decision making. With some advanced machine learning models like Platt-Burges, we may be able to improve the collective cognition by a tiny margin. But no model can fix the copycat behavior among research analysts. According to EuroMoney, investment banks produce roughly 8000 research reports a day, adding up to 3 million each year, of which maybe 5% are actually read. With so few headcounts and so much pressure around earning release, I just cannot believe they are capable of producing insightful and counter-consensus reports. A few years back, I read some reports erroneously comprise decision tree to determine the causality of some variables, as if to reassure the readers with a scientific guarantee: the mathematical result is stated as an inarguable truth in order to establish the argument. On the contrary, their lack of knowledge in machine learning creates no credibility at all, I sincerely hope that MiFiD II has sent these clowns out of jobs.
Discussion
Always remember that the crowd that applauds your coronation is the same crowd that will applaud your beheading. People like a show.
--- Terry Pratchett, Going Postal
What exactly is wisdom of crowds? Let’s define the crowd first. The crowd should be characterized by a diversity of components that enables a complementarity of viewpoints, interests and knowledge. Instead of the toxic ethnicity and gender talk, diversity refers to differences in problem solvers’ perspectives and heuristics variations in how people encode and search for solutions to problems (Hong & Page, 1998). There is certain doxa that wisdom of crowds exists because the aggregation eliminates the idiosyncratic error of the individual judgement. This can be proved in a more rigorous way. In statistics, König-Huygens formula signifies that the variance of a random variable is equal to the difference between the expected value squared and the square of the expected value.
Var(X)=E(X^2)-E^2(X)
This translates to “diversity prediction” theorem proposed by Lu Hong and Scott E. Page. The greater the diversity, the better the collective performance. The squared error of group individuals (E(X^2)) equals to the error of the group (E^2(X)) plus the diversity of the group (Var(X)). Since we cannot alter the individual cognition, the rise of the variance (diversity) must be offset by the drop of the group error. While the variance term is non-negative, this guarantees the episteme that the error of the group is always smaller than the average error of group individuals. Hence, wisdom of crowds exists, but not without perquisites. As we have emphasized, the essential element of a good crowd is diversity. A homogenous crowd is more likely to send Socrates to death and Thucydides to exile. Another caveat is independence. Humans are sociable creatures who operate in crowds. When our independent thinking declines, we start to imitate others around us and follow blindly towards a relatively arbitrary position. The diversity of the crowd vanishes.
Wisdom of crowds in the financial industry is fictional. This article has invoked three different methods to provide evidence for the idea: spot price is king and consensus price is garbage. Then why are portfolio managers still wasting time to reading these crappy reports? Alpha is rare. They can only chase alpha with disruptive innovation rather than plagiary among the banks. Are they really that dumb? No. “No one ever made a decision because of a number. They need a story”, said by Nobel laureate Daniel Kahneman. Nobody reads bank reports to gain insight of the future. They just need a story to persuade their fund managers to trade. When shit goes wrong, they can always blame it on some lame analysts. That is the wisdom of crowds!
Further Reading
- Dawid AP, Skene AM (1979) Maximum Likelihood Estimation Of Observer Error-rates Using The EM Algorithm
- Dempster AP, Laird NM, Rubin DB (1977) Maximum Likelihood From Incomplete Data Via The EM Algorithm
- Ge H, Welling M, Ghahramani Z (2015) A Bayesian Model For Calibrating Reviewer Scores
- Hong L, Page SE (2004) Groups Of Diverse Problem Solvers Can Outperform Groups Of High-ability Problem Solvers
- Kelley EK, Tetlock PC (2012) How Wise Are Crowds? Insights From Retail Orders And Stock Returns
- Nofer M, Hinz O (2014) Are Crowds On The Internet Wiser Than Experts? The Case Of A Stock Prediction Community
This is the original paper of Dawid-Skene model where the model is used to assess a patient’s true response in regarding to different answers to different clinicians. Although for a gentle introduction, I would recommend Fast Dawid-Skene by Vaibhav B. Sinha et al.
This is the original paper of Expectation Maximization algorithm. It is one of the most common algorithms in unsupervised learning where you cannot solve the partial derivatives in closed form.
This is the only existing paper on Platt-Burges model and its more advanced variations. In contrast to EM approach in this article, this paper solves the equation in ridge regression. An alternative material would be Neil Lawrence’s personal blog.
This is the paper where the authors use agent-based model to prove “diversity trumps ability” theorem. A diverse group of people regardless of their empirical or theoretical knowledge is better than a group of best performing individuals and experts.
This paper studies a database of executed retail trades with its value over $2.6 trillion via multivariate regression. It shows that retail trading from the crowd conveys information about future stock prices.
This paper proves that an amateur crowd on the internet is able to make better predictions on DAX than professional analysts from banks, brokers and research companies via multivariate regression. Hooray to Deutsche WallStreetBets!
Click the icon below to be redirected to GitHub Repository