Quant Trading - Monte Carlo
Monte Carlo simulation in trading is nothing but house of cards.
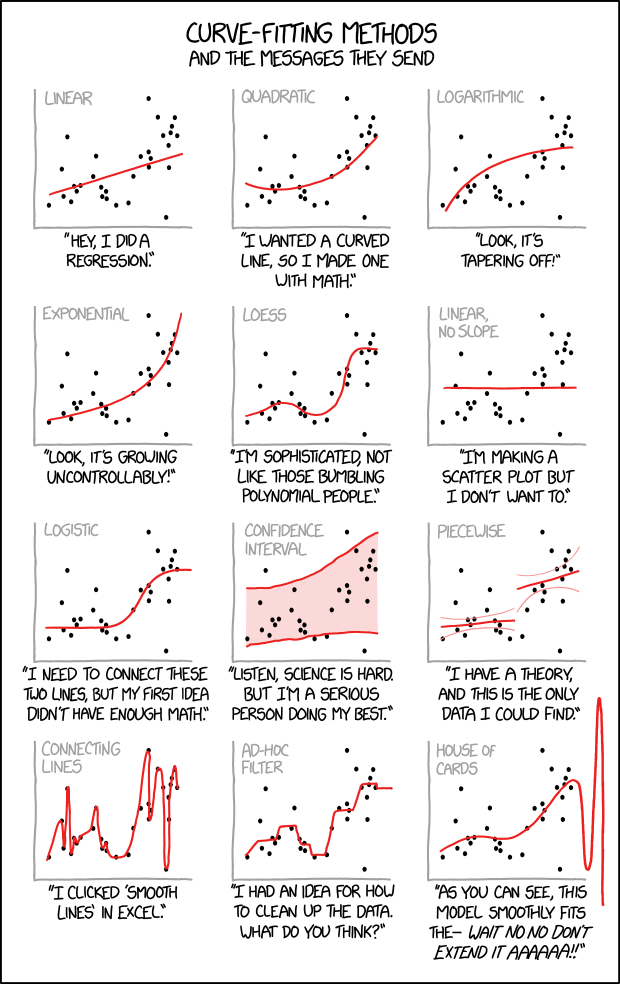
Why do I put this picture (see here for explanation) right in front of everything? Have I caught your attention? Hopefully I have. These days, blogs on data science topic are dime a dozen. Some blogs teach you how to use decision tree/random forrest to predict the stock price movement, others illustrate the possibility of back-propagation neural network to forecast a bond price. The brutal truth is, most of them are nothing but house of cards. So far, I have not heard any quant shops hit the jackpot via machine learning. Most applications of machine learning in trading are leaned towards analytics rather than prediction or execution. One quant estimates the failure rate of machine learning in live tests of trading is at about 90%.
Monte Carlo, my first thought on these two words is the grand casino, where you dress up in tuxedo, meet Famke Janssen after car chase and introduce yourself in a deep sexy voice, 'Bond, James Bond'. Indeed, the simulation is named after the infamous casino in Monaco near Côte d'Azur. It actually refers to the computer simulation of massive amount of random events. This unconventional mathematical method is extremely powerful in the study of stochastic process. Here comes the argument on Linkedin that caught my eyes the other day. "Stock price can be seemed as a Wiener Process. Hence, we can use Monte Carlo simulation to predict the stock price." said a data science blog. Well, in order to be a Wiener Process, we have to assume the stock price is continuous in time. In reality, the market closes. The overnight volatility exists. But that is not the biggest issue here. The biggest issue is, can we really use Monte Carlo simulation to predict the stock price, even a range or its direction?
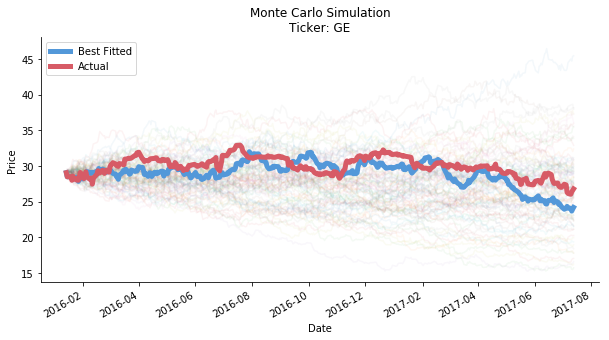
The author offered a quite interesting idea. As he suggested, the first step was to run as many simulations as possible on stochastic differential equations to predict stock price. The goal of simulations was to pick a best fitted curve (in translation, the smallest standard deviation) compared to the historical data. There might exist a hidden pattern in the historical log return. The best fitted curve had the potential to replicate the hidden pattern and reflect it in the future forecast. The idea sounds neat, doesn't it? Inspired by his idea, we can build up the simulation accordingly. To fully unlock the potential of Monte Carlo simulation on fat tail events, the ticker we pick is General Electric, one of the worst performing stock in 2018. The share price of GE plunged 57.9% in 2018 thanks to its long history of M&A failures. The time horizon of the data series is 2016/1/15-2019/1/15. We split the series into halves, the first half as training horizon and the second half as testing horizon. Monte Carlo simulation will only justify its power if it can predict an extreme event like this.
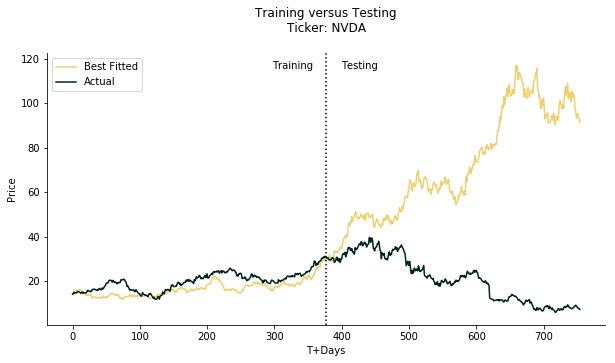
Let's take a look at the figure below. Wow, what a great fit! The best fit is almost like running a cool linear regression with valid input. As you can see, it smoothly fits the curve in training horizon.
If we extend it to testing horizon...
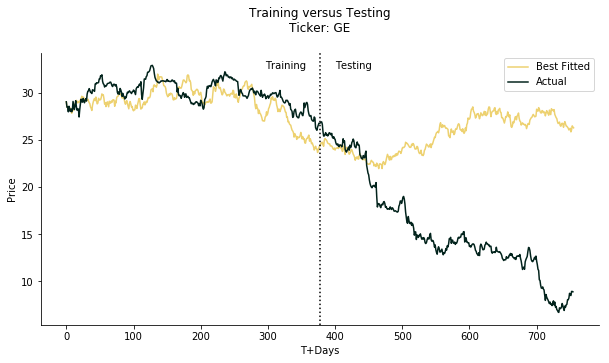
Oops, house of cards collapses. The real momentum is completely the opposite to the forecast, let alone the actual price. The forecast looks quite okay for the first 50 days of testing horizon. After that, the real momentum falls like a stone down through the deep sea while the forecast is gently climbing up. You may argue the number of the iterations is too small so we cannot make a case. Not exactly, let's look at the figure below.
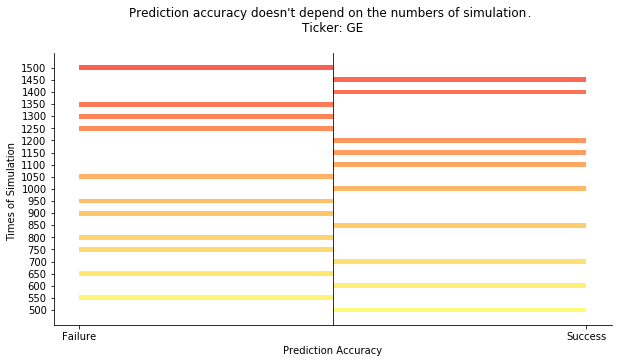
We start from 500 times of simulation to 1500 times of simulation. Each round we increase the number by 50. We don't look at the actual price forecast, just the direction. If the end price of testing horizon is larger than the end price of training horizon, we define it as gain. Vice versa. Only when both actual and forecast directions align, we consider the forecast is accurate. As the result shows, the prediction accuracy is irrelavant to the numbers of simulation. The accuracy is more sort of tossing a coin to guess heads or tails regardless of the times of simulation. If you think 1500 is still not large enough, you can definitely try 150000, be my guest. We don't have so much computing power as an individual user (frankly no patience is the real reason) but I can assure you the result is gonna stay the same. Law of Large Numbers theorem would not work here.
Now that the prophet of Monte Carlo turns out to be a con artist. Does Monte Carlo simulation have any application in risk management? Unless you are drinking the Kool-Aid. Let's extend the first figure a little bit longer to the end of testing horizon.
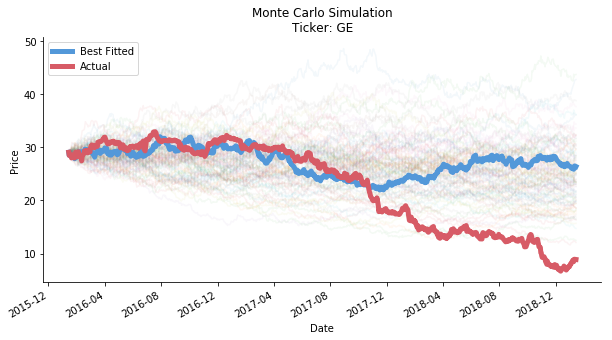
Obviously, out of 500 times of simulation, none of them successfully predict the scale of the downslide. The lowest price of 500 predictions is 10.99 per share. It is still way higher than the real bottom price at 6.71 per share (no wonder GE got its ass kicked out of DJIA). The so-called fat tail event simulation is merely a mirage. If you think GE in 2018 is an extreme case, you'd be so wrong. The next ticker we test is Nvidia from 2006/1/15 to 2009/1/15. In 2008, the share price of Nvidia dropped 75.6%!! The financial crisis is the true playground for risk quants. By default, we continue to split the time horizon of NVDA into two parts by 50:50. The result is in the figure below.
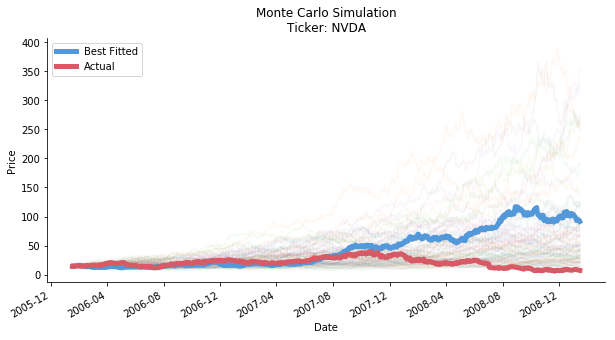
Undoubtedly, the best forecast fails the expectation again. It cannot accurately predict the direction of the momentum. For the extreme event, Monte Carlo simulation cannot predict the scale of downslide, again! 6.086 per share is the lowest price we achieve from our 500 times of simulation, yet the actual lowest is at 5.9 per share.
Still thinking about Monte Carlo for your next big project?
Click the icon below to be redirected to GitHub Repository